Client
L'Oreal APAC
Timeline
Sept - Nov 2022
My Role
UX designer
Lead UI designer
Current Status
Online
BACKGROUND
A 0-to-1 Product
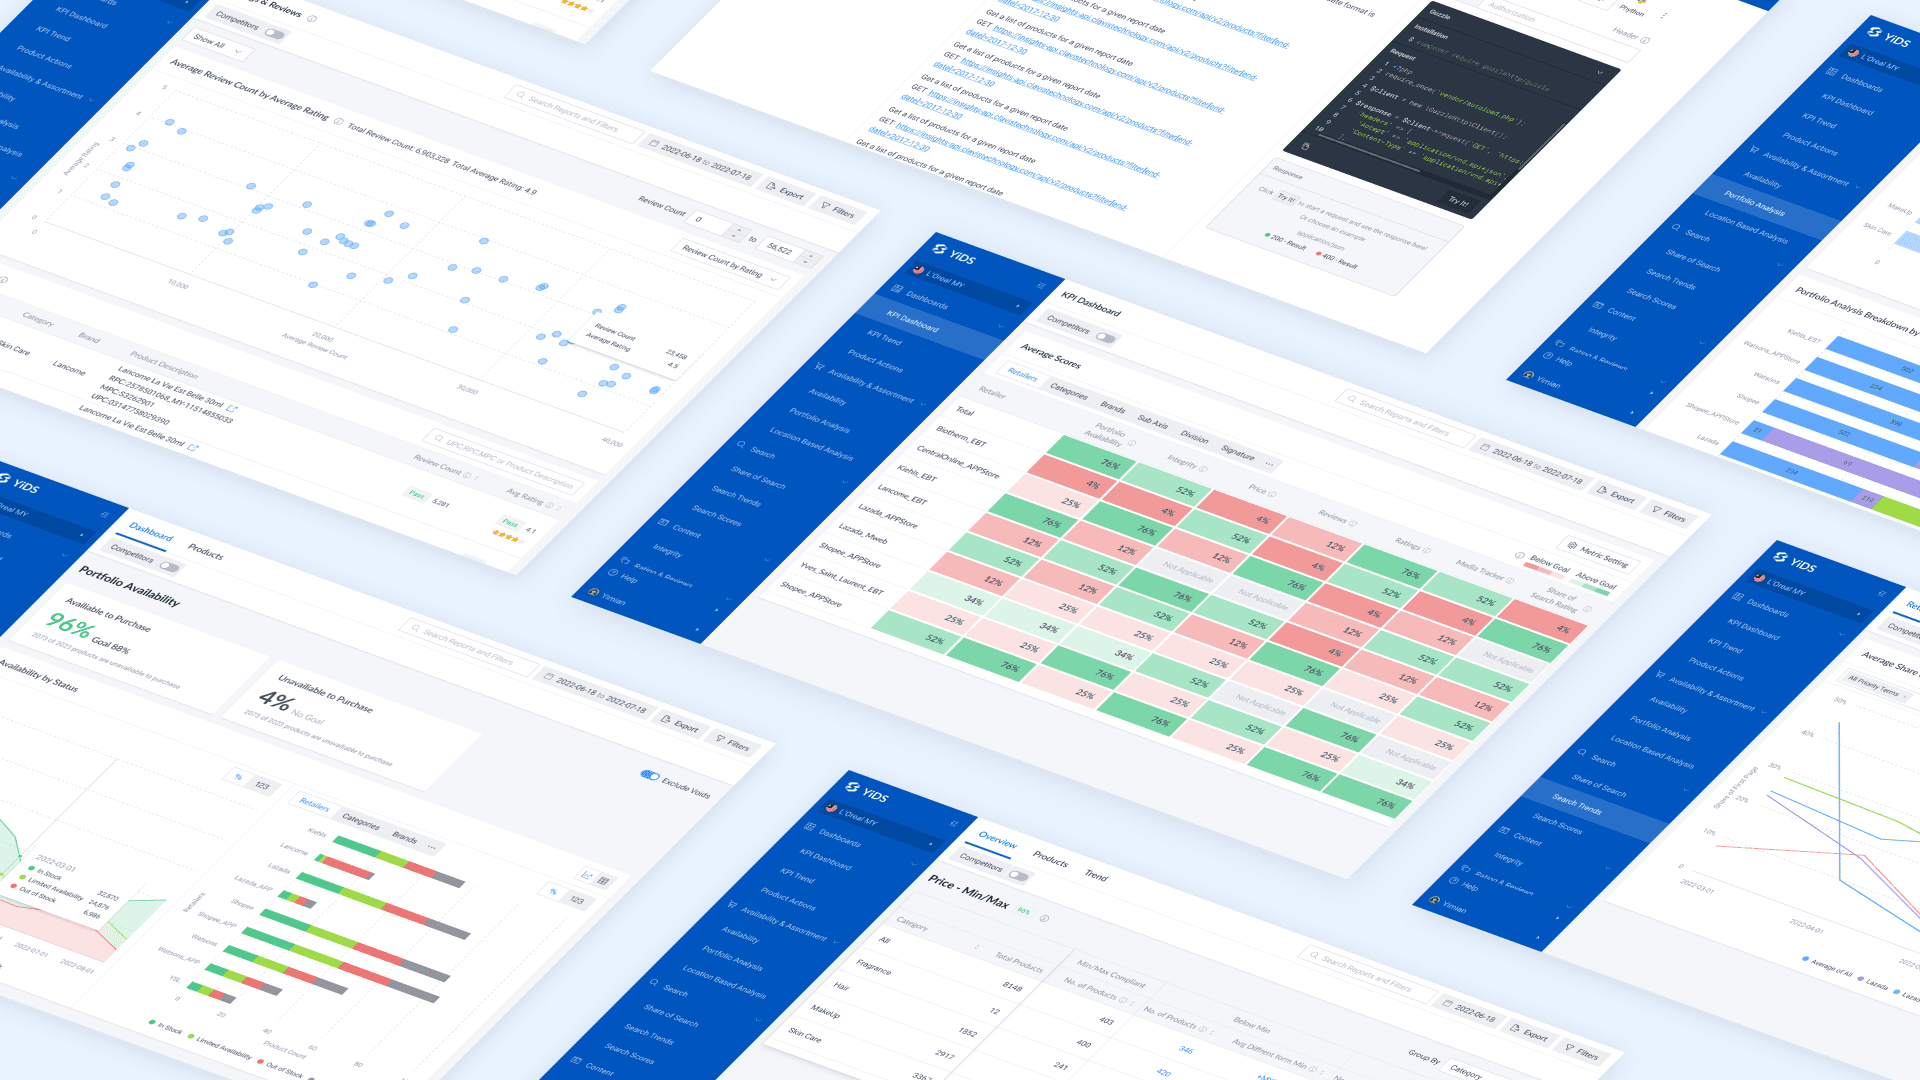
Flywheel Digital delivers premium e-commerce analytics to Fortune 500 brands across the Asia-Pacific region. The Digital Shelf, a 0-to-1 product development, integrates six critical metrics (Sales KPIs, Availability, Search, Integrity, Reviews, and Pricing) in one comprehensive platform. This solution uniquely enables clients to benchmark against competitors, requiring innovative visualization approaches to transform massive datasets into actionable insights.
ANALYSIS
Identify the Challenges
Given the complexity of this project, we identified three main challenges that needed to be addressed:
Highly Customisable Data Range: Our client required the ability to select data across eight dimensions and choose whether or not to include competitors' data.
Multiple Types of Data Visualisation: With six factors in the data set, we faced the challenge of determining the most effective way to visualise each type of data.
In-Depth Data Interaction: Our client desired the capability to delve deeply into the data, allowing them to view detailed insights to inform their business strategies.

FILTER
Filters in navigation bar
We introduced a new filter component that not only allows users to customise their data selection but also integrates seamlessly with the navigation bar. This design enables users to view results and make adjustments effortlessly.
CHARTS
Comprehensive data visualisation
To ensure efficient representation of various data types, we implemented six distinct chart formats. These include: Heat maps, Bar charts, Line charts, Stacked area charts, Bubble charts, Stacked bar charts.

INTERACTION
Interactive data exploration
To empower users with in-depth data analysis capabilities, we designed a suite of interactive charts. These dynamic visualisations enable users to: examine details on demand, make direct comparisons between data points, and combine or isolate specific dimensions.
IMPACT
Results of the launch
The launch of our new data visualisation platform yielded impressive results: Our client swiftly integrated the dashboard into their APAC market analysis processes, demonstrating the platform's intuitive design and immediate value. The client reported a significant acceleration in their strategy formulation. The ability to quickly visualise complex data relationships led to more informed and timely decisions. Additionally, the platform's efficiency and unique features attracted the attention from several Fortune 500 companies, who reached out to explore trial opportunities.